An increase in organic traffic and an uplift in conversions are just two of the benefits you can expect to see from the outset when you uplift your career site using Clinch. With recruitment marketing best practices in mind from concept to construction, a Clinch career site delivers ROI right out of the box.
However, in order for your career site to maintain momentum, it’s important that you make it a point to measure its effectiveness —particularly in several key areas.
Clinch lets you track and interpret candidate behaviour and engagement with your career site content to understand who is visiting your site, how they got there, and what further action they are taking on arrival.
Armed with these insights, you can effectively gauge your ROI at every stage of the recruiting funnel. You can then edit, iterate, and improve your existing content, practices, and processes for the best results.
If you’re wondering how to get started, we’ve got you covered. Check out these 5 commonly asked questions below, and the Clinch metrics that can answer them.
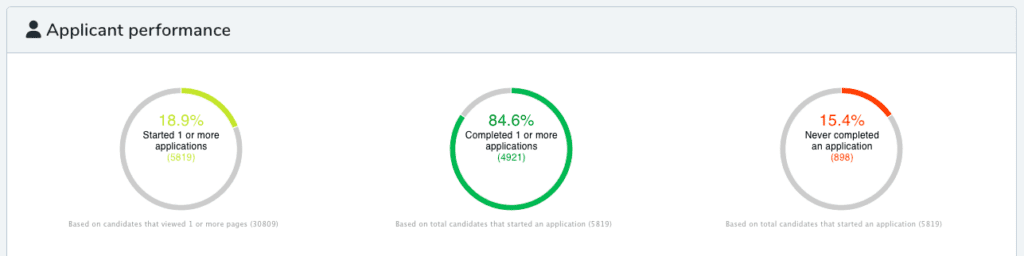
1. Quantity: Is my career site driving conversions?
Key metrics:
- Conversion rate of Visitors to Potential Candidates and,
- Potential Candidates to Started Application
What determines a career site’s effectiveness is somewhat subjective. For some companies, a high number of applicants may be the ultimate measure of success. For others, growing their talent pool to ensure robust talent pipelines now or further down the line may take priority.
What’s true in all cases is that an effective career site is one that gives candidates the information they need, when they need it. This information should allow them to easily self-select into —or out of —the recruitment process at any time.
If applicant volume is your main concern, you can see how effective your site is by looking at the number of candidates who visited your career site in a given period and later started an application.
If you’re focusing on building an active and increasing talent pool, zone in on the number of candidates who visited your career site in a given period and demonstrated interest in your organisation by converting through any data-capture form/CTA.
Industry standards combined with our own data suggest benchmark conversion rates of 15%+ from Visitors to Potential Candidates, and 80% from Potential Candidates > Started Application.

2. Quality: Is my career site and/or job converting the right type of candidates?
Key metrics:
- Hired to Visitors ratio and/or
- Conversion rate of Completed Application to Candidates
Where the volume of applications is not a concern, what does become a priority is being able to establish, ideally at-a-glance, what portion of those applications received are high-quality. Indeed, for the majority of organisations, quality of hire has now surpassed time-to-fill as a recruitment top priority.
By looking at the Hired to Visitors ratio and/or the conversion rate of Completed Application to Candidates metrics available in Clinch Reports, you can see quickly and easily, respectively, how many career site visitors it takes to secure one new hire and/or the percentage of applicants who went on to be deemed ‘Successful’ as defined by your ATS status settings. Industry standards point to 10-15% as a benchmark for success.
Gender Breakdown
Reports can also be used to gauge the gender breakdown of the audience engaging with your content. They can also help you to see the gender split at any given stage in the application process. These insights are valuable if, for example, you have launched a campaign with a view to hiring more female software developers.
3. How easy or difficult is my application process?
Key metrics:
- Conversion rate on Started Application to Completed Application and/or
- Drop-Off Rate
While a career site that is visually engaging, informative, and accessible is central to a successful recruitment marketing strategy, it’s important to pay attention also to the influential role of the job application itself.
The application form, as well as the processes you have in place prior to and post-application, can influence whether or not a would-be ideal candidate completes the journey from Visitor to Hired.
While industry research indicates a typical application drop-off rate of 80% (Glassdoor, via Avature), the average across the Clinch data set is just 24%. We attribute this to our clients following our best practice guidelines that encourage a “low barrier to entry,” including:
- requesting only the most pertinent candidate information which shows you respect the candidate’s time, and
- using automation to inform and engage applicants at all key stages of the recruiting funnel.
4. Which traffic sources are providing the most value?
Key metric: Top Sources table
When your new Clinch career site goes live, Clinch’s automated optimization measures can deliver as much as a 26% increase in the number of visitors to your site. By activating your inbound sourcing strategy (for example, ensuring that your jobs are automatically widely distributed by leveraging multi-channel posting through Clinch), you can push that number even higher.
With a steady flow of visitors in place, and strong conversion rates on top of that, you can then look to identify which traffic sources are proving most fruitful. This is information that can help you reduce recruiting costs and decide where to spend your time and money. Recruitment marketing analytics shine a light not only on the original source of hire, but also attribute the number of successful candidates generated to each individual social channel, jobs board, and/or search engine.
Use the Traffic screen > Top Sources table in Reports, and apply the relevant channel filter to identify first, which sources are sending the most traffic your way. Then, bearing in mind that quantity does not necessarily mean quality, look to the key metrics including ‘Started Application, (1.)’ ‘Candidates (2.),’ and ‘Hired (3.)’ to establish for each individual source:
- Whether or not the majority of visitors are arriving at your career site with a view to starting an application.
- The percentage of applications received that go on to be successful.
- How many visitors are translating into hires.
5. Does my career site encourage repeat visits?
Key metric: Returning visitors circle graph
Increased traffic from the outset is a welcome result of your new-look careers site. But you want to make sure that as time goes on, you are striking a good balance between new and returning visitors.
Both are important –but since returning visitors are more likely to convert, for example, applying for a job, or joining your talent network, let’s focus on them.
Check out the returning visitors circle graph in the Visitor Behaviour table under Reports > Candidates to see how effective your career site is when it comes to encouraging repeat visits. Industry standards recommend aiming for a repeat visitor rate of 10% to 30%.
If your rate of returning visitors is less than 10%, there are two areas to examine for improvement opportunities:
- Consider the “stickiness” of your career site: make sure your content speaks to the candidates’ needs pre- and post-apply. Strive for wording and visually engaging elements that deliver real value and give visitors a reason to come back for more.
- Make use of targeted automation capabilities: keep your company front-of-mind with candidates and encourage return visits by delivering automated emails with links to relevant blog posts or career site content, for example. Segment your talent pool based on area of interest or location, for example, and set up targeted, automated emails that speak to those personal details.